Sometimes when creating performance testing scripts, you will stumble upon vulnerabilities in the application under test.
Maybe you will miss a value you should have correlated before sending to the server, and when you go back and check your script you will find that (hypothetically) the web store is allowing you to purchase every item in their inventory for $9.95.
This is the sort of problem that will never show up under functional testing, as the client application should always sent good (validated on the client side) data to the server. Once you expose your application to the world by putting it on the Internet, you can no longer expect to receive only sanitised inputs.
A recent project I was involved with brought in a security test team from PwC to audit the application. It was mind-blowing how many small security problems a relatively stable piece of software can have.
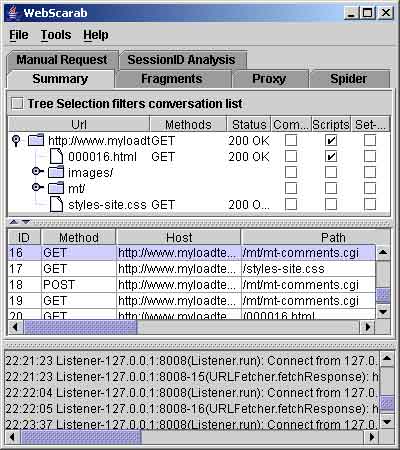
The test team were using Open Web Application Security Project‘s WebScarab tool. At a basic level, this tool is just a proxy that will allow you to modify the HTTP requests that are sent to the application.

This tool is a lot of fun to play with (for web geeks like me, anyway); just don’t get carried away and start trying out SQL injection attacks you find on BugTraq on other people’s websites.
4 Comments
Comments are closed.


This looks good, thanks for the heads-up.
Chris
I downloaded the webscarab tool ,but i get only two panels Summary and Intercept. Do i need to download something more to to view other panels (Manual Request,SessionID analysis,Fragments,Proxy,Spider).
Problem might be with system configuration….not sure abt
Earlier i tried to install in Vista system and faced the same……Working fine in XP.
The reason you dont have the other tabs is because you have not enabled them as yet, to enable them do this:
1) Click TOOLS->Use full-featured interface
2) Restart Web Scarab
You can switch back to the 2 tab version in the same way.